Emerson Texas October 2026 poll
TEXAS ELECTION POLLING 2026-10-22
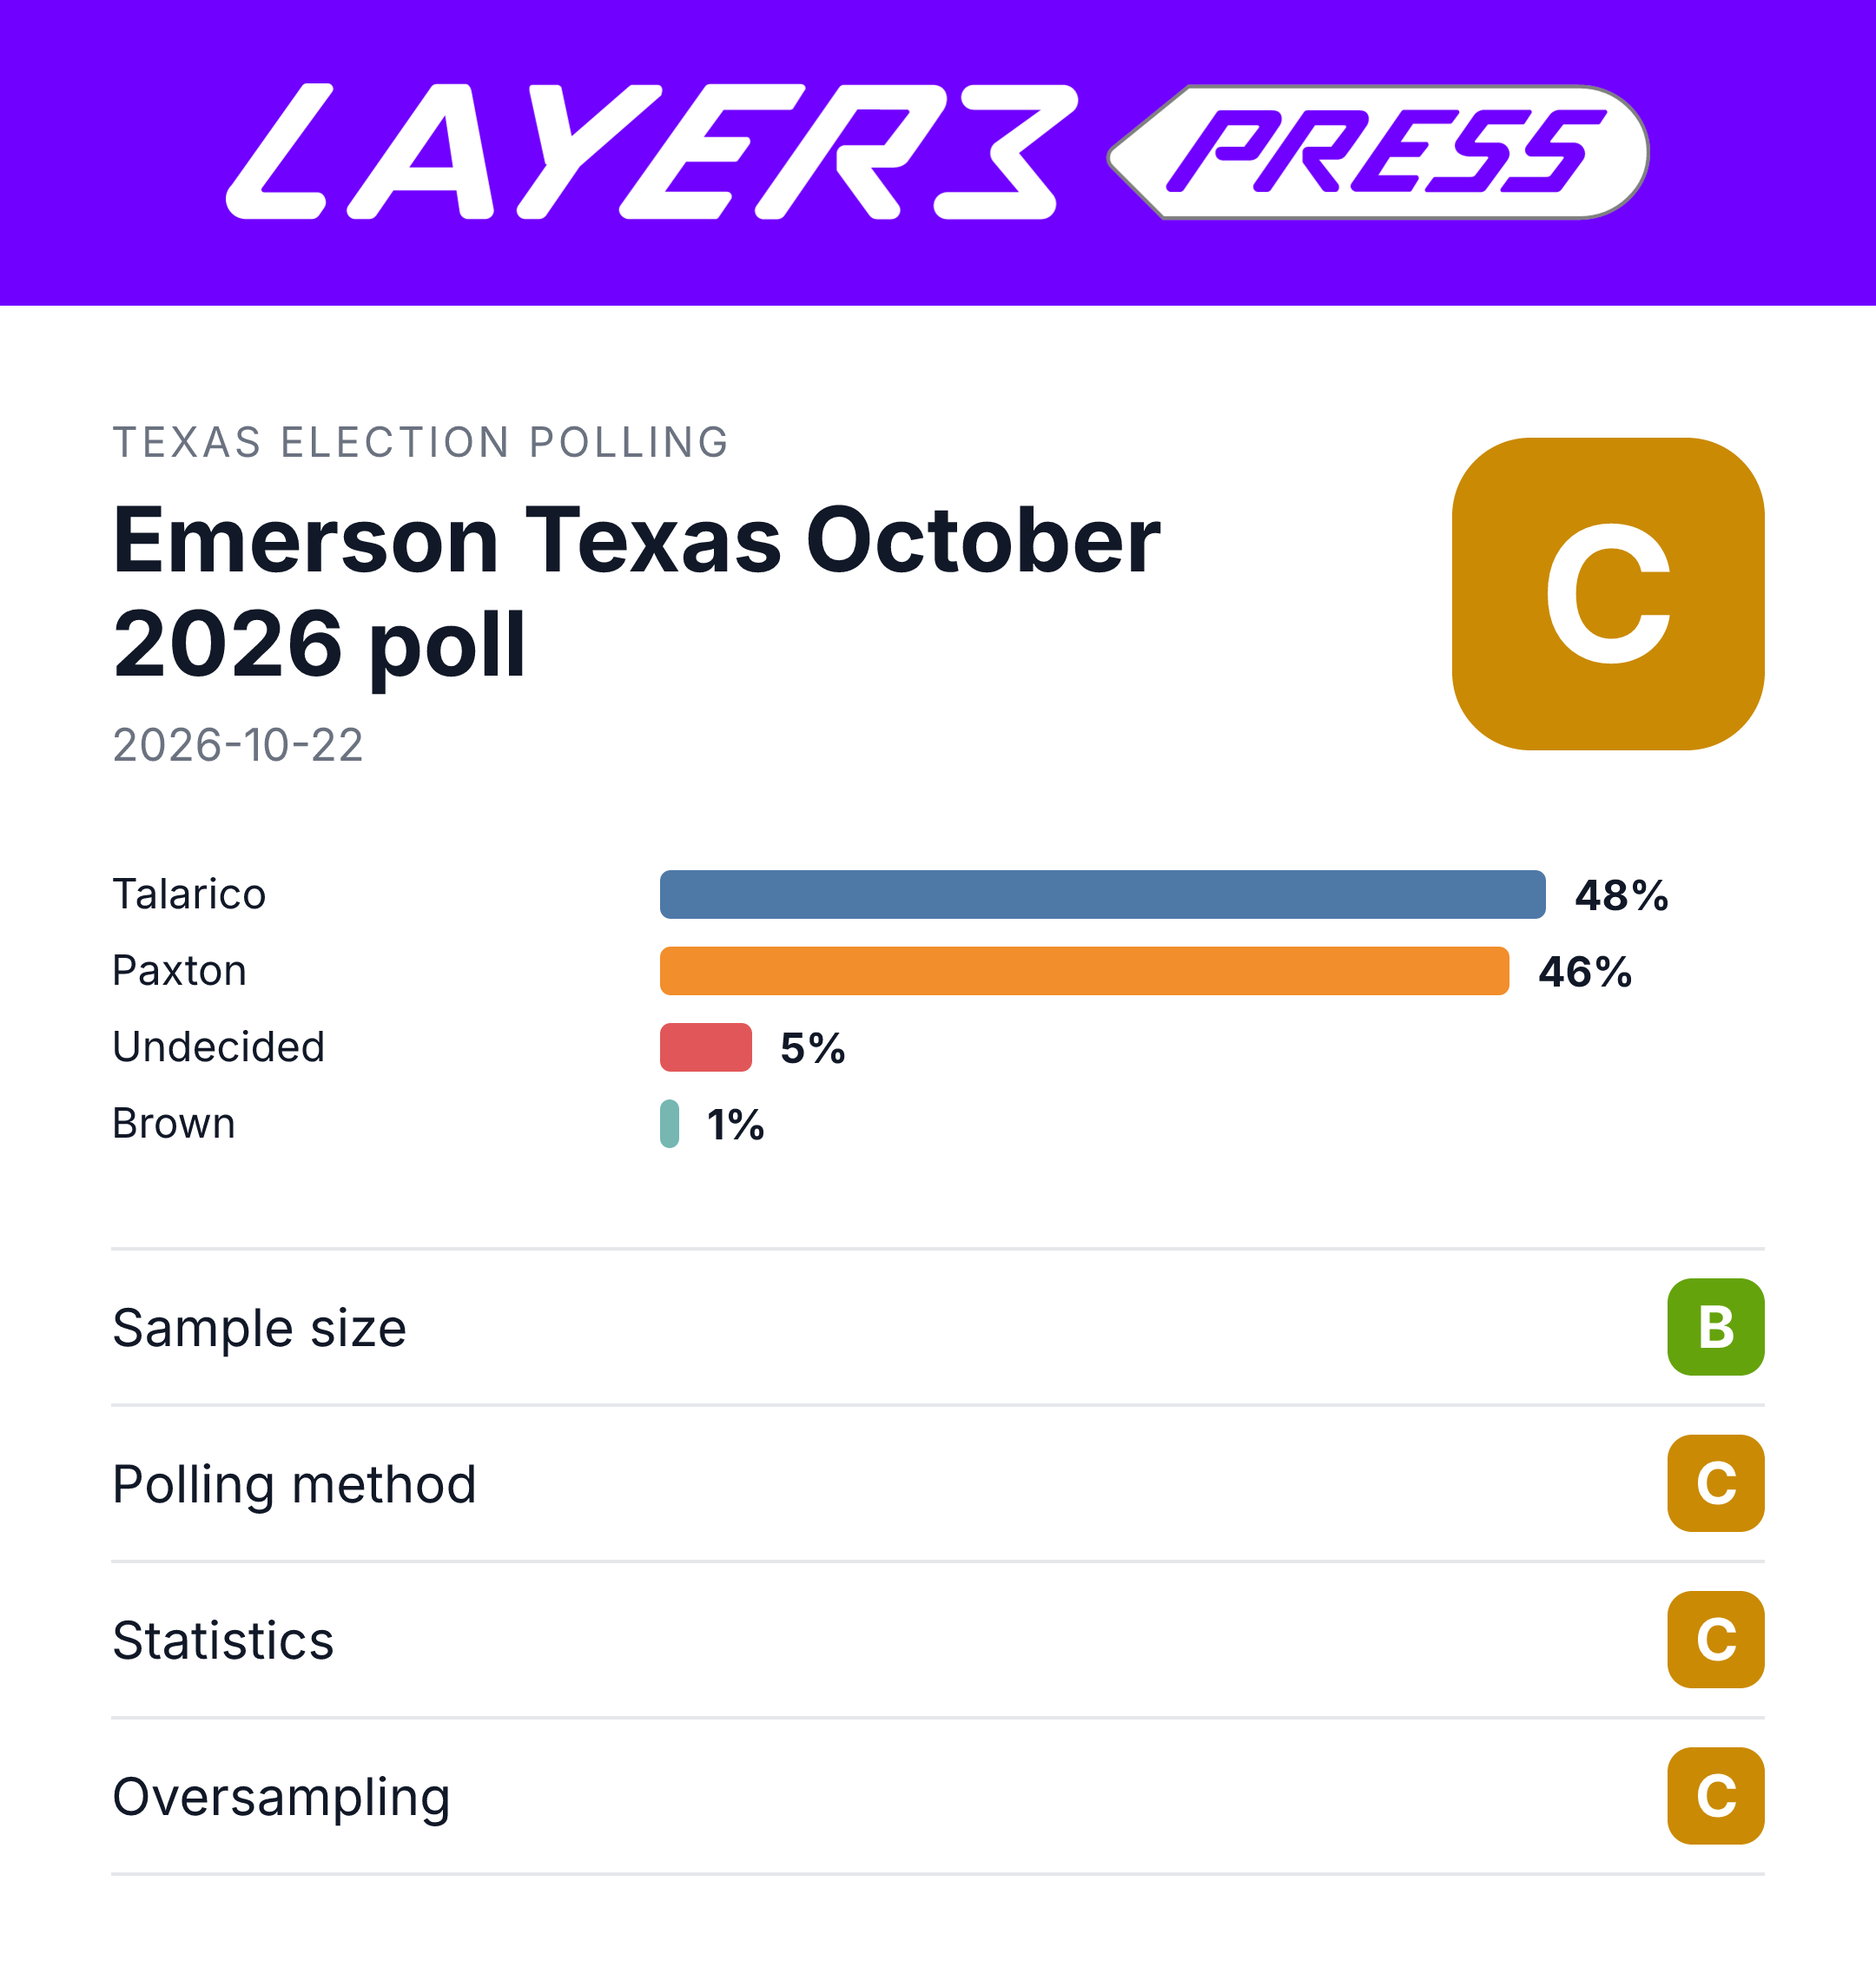
Overall grade: C
The published 48%–46% Senate result and 49%–45% governor result pass the reported-figure and arithmetic checks, but their statistical significance is not established. Screening, exact questionnaires, oversampling, and full-table inputs remain insufficiently verified, while the uncertainty calculation is not reproducible from the checked methodology. The forecast about Brown’s 3% support lacks verified second-choice evidence.
Confidence: Medium. All five claims were checked and no check or analysis errored, but six failed source fetches involving three workbooks left screening, subgroup evidence, comparability, and uncertainty inputs unchecked.
Graded assessments
- Polling method — C: Three collection modes, English/Spanish interviewing, and weighting variables are disclosed. Exact recruitment/selection procedures, weighting targets, ballot wording/order, and turnout-screen routing remain insufficiently verified; registered-voter recruitment alone does not establish an invalid likely-voter sample.
- Statistics — C: The release reports n=1,000 and a ±3.1-point credibility interval, but the checked methodology supplies no reproducible interval formula, design effect, effective sample size, or lead/change-specific tests. Finding-specific bases, missing-data and nonresponse handling, and multiple-comparison procedures were not established; the workbook was inaccessible.
- Oversampling — C: The evidence does not assess deliberate oversampling within the 1,000-person sample. Recruitment allocations, oversampling rates, and corresponding weighting adjustments remain unchecked, not demonstrated defects.
- Sample size — B: The overall n=1,000 is clearly reported with an uncertainty interval. Brown-supporter and other finding-specific bases could not be checked, and effective sample size after weighting is not supplied in the reviewed methodology.
- Methods — C: Population, registered-voter recruitment, field dates, modes, languages, weighting variables, and benchmark sources are identified. Exact selection procedures, questionnaire wording/order, weighting targets, and likely-voter screening could not be fully checked; preregistration and deviations were not assessed.
- Conclusions — C: The reported leads and monthly movements are numerical, not statistically established advantages or trends. The forecast about Brown’s 3% support lacks verified second-choice preferences.
- Findings — B: All five checked claims match the published estimates or attributed commentary, and rounded arithmetic checks out. The economy’s 36%–39% change and Talarico’s 46%–48% rise do not establish genuine changes in voter preferences.
- Data — B: Published toplines support the headline ballots and issue rankings. Full-results tables and crosstabs could not be fetched, and respondent records, code, and individual weights were unavailable; failed access does not establish nondisclosure.
- Replication — C: Rounded totals, leads, and changes were reproduced, but unrounded shares, leaner transitions, and design-adjusted uncertainty could not be reconstructed without the workbook, respondent records, weights, and interval formula. News coverage is not independent replication, and governor leaner figures differ across sources.
- Funding — B: Nexstar Media is named as sponsor. Commissioning and separate payment arrangements could not be checked in the workbook, and author/sponsor conflicts of interest were not covered by the evidence.
Fact-check report
- Rating: Reliable
- Date checked: October 28, 2026
- Text published: October 22, 2026
- Claims checked: 5 verified; 0 wrong or misleading; 0 unverifiable
- Sources linked: 13 URLs; 6 unavailable URLs concern three full-results workbooks.
Overall assessment
Reliable. The five checked claims accurately describe Emerson’s published poll estimates and its director’s conditional forecast. The reported leads and changes are numerical differences, not established statistically significant advantages or trends. The full-results workbooks were unavailable, limiting verification of unrounded estimates, uncertainty, voter screening, and Brown supporters’ preferences; no newer poll result was supplied.
Claims
1. Talarico led Paxton 48% to 46%; including undecided voters’ leanings, support was 49% to 48%
Verified.
Emerson’s October release reports the following for Texas likely voters surveyed October 17–19, 2026:
Senate choice | Initial ballot | Including leaners |
|---|---|---|
James Talarico | 48% | 49% |
Ken Paxton | 46% | 48% |
Ted Brown | 1% | 3% |
Undecided | 5% | — |
Arithmetic recomputed from the published rounded figures confirms that both ballots total 100%. Talarico’s lead narrows from 2 percentage points to 1 point. The candidates’ increases—1 point for Talarico, 2 for Paxton, and 2 for Brown—total the initial 5% undecided.
The survey covered 1,000 Texas likely voters, with a reported overall ±3.1-percentage-point credibility interval and a general 95% coverage statement. Emerson disclosed weighting by gender, education, and region, with text-to-web, landline interactive voice response, and panel interviews in English and Spanish.
These calculations confirm consistency with the release, not an independent reconstruction from respondent data. Unrounded weighted shares and individual leaner transitions could not be checked without the full-results workbook and respondent data. No candidate-difference interval or p-value was supplied, so the overall ±3.1-point interval does not establish a significant Talarico lead.
The KXAN report republished by AOL agrees with all six Senate percentages it reports but omits Brown’s initial 1%. It describes uncertainty as a 3% margin of error, rather than Emerson’s ±3.1-point credibility interval. This is secondary reporting, not independent confirmation from polling data.
2. Abbott led Hinojosa 49% to 45%; including leaners, support was 51% to 47%
Verified.
Emerson’s release gives these estimates for the same October 17–19, 2026 sample:
Governor choice | Initial ballot | Including leaners |
|---|---|---|
Greg Abbott | 49% | 51% |
Gina Hinojosa | 45% | 47% |
Pat Dixon | 1% | 2% |
Undecided | 4% | — |
Recomputed from those rounded figures, Abbott’s lead is 4 percentage points on both ballots. Initial categories total 99%; leaner-inclusive categories total 100%. Rounding could explain the initial shortfall, but unrounded values were unavailable.
Emerson’s governor chart also supports the initial figures. However, KXAN’s report and its AOL republication give leaner-inclusive support of 51% Abbott, 46% Hinojosa, and just under 3% Dixon. The primary polling release takes precedence for this claim, but the missing full-results tables prevent reconciliation.

Explanations tested
Open — Abbott’s four-point lead is not statistically distinguishable from a tie at the 95% level.
Illustrative calculations using the published shares and assuming a simple random sample produce these 95% intervals for Abbott minus Hinojosa:
- Initial ballot: −2.00 to 10.00 percentage points
- Including leaners: −2.13 to 10.13 percentage points
Both include zero. They account for mutually exclusive candidate choices but assume a design effect of 1; they are not Emerson’s official intervals. Emerson’s methodology page describes Bayesian analysis without an operational formula sufficient to reproduce these results.
The hypothesis therefore remains open. The full-results ballot bases, unrounded shares, covariance and design adjustments, and reproducible interval specification would determine whether the actual interval includes zero. Comparing the four-point lead directly with the overall ±3.1-point interval does not settle that question.
Open — Emerson overstates Hinojosa’s leaner-inclusive support by about one point and understates Dixon’s by about one point.
The release’s 51%/47%/2% conflicts with KXAN’s 51%/46%/just under 3%. Hinojosa’s discrepancy is exactly 1 point in the printed figures; Dixon’s exact discrepancy cannot be calculated from “just under 3%.”
Both accounts describe the overall ballot after undecideds were pressed, rather than an identified different subgroup. Their initial figures agree at 49%/45%/1%, with 4% undecided. Neither disagreement establishes an Emerson error without the workbook’s unrounded values, ballot labels, weighted denominators, and rounding rules.
3. The economy was the top issue at 39%, up three points from September
Verified.
Emerson’s October release reports:
- Economy: 39%
- Immigration: 16%
- Threats to democracy: 13%
- Education: 12%
- Healthcare: 9%
The September release reports the economy at 36%, followed by immigration at 14%, education at 12%, and healthcare and threats to democracy at 11% each. Subtracting the published economy shares confirms a 3-percentage-point increase, with the economy leading the listed issues in both surveys.
Both surveys reported 1,000 Texas likely voters. September fieldwork was September 12–14, 2026, with a ±3-point credibility interval; October fieldwork was October 17–19, 2026, with ±3.1 points. The figures and rankings rest on the releases’ published estimates; respondent responses and weights were unavailable for independent re-estimation.
Explanation tested
Open — The economy’s increase from 36% to 39% is not statistically distinguishable from no change at the 95% level.
Two illustrative calculations include zero:
- An approximation using the published interval widths gives a 95% interval for the change of −1.31 to 7.31 percentage points.
- An independent, unweighted-binomial calculation using the rounded proportions and sample sizes gives −1.24 to 7.24 points.
Neither reproduces Emerson’s Bayesian or design-adjusted method. The surveys also differ in disclosed weighting, collection modes, and language coverage; identical question wording and response options could not be verified.
The arithmetic increase is confirmed, but a statistically established change in priorities is not. The two questionnaires, issue-specific bases, unrounded estimates, effective sample sizes or design effects, cross-wave covariance assumptions, and an operational uncertainty formula would settle the hypothesis.
4. Talarico’s support rose about one point each month, while Paxton stayed between 46% and 47%
Verified.
The published initial-ballot estimates in Emerson’s August, September, and October releases support the description:
Candidate | August | September | October |
|---|---|---|---|
James Talarico | 46% | 47% | 48% |
Ken Paxton | 47% | 46% | 46% |
Arithmetic from those rounded shares confirms two consecutive 1-point increases for Talarico, or 2 points overall. Paxton’s range is 46%–47%. These are not the October leaner-inclusive figures of 49% and 48%.
The September release explicitly said there had been “no significant movement.” The rounded sequence establishes a descriptive trend, not a statistically established increase.
Explanation tested
Open — Talarico’s rise from 46% to 48% is compatible with sampling variation rather than an established increase.
The August 9–10 and October 17–19, 2026 polls each reported 1,000 Texas likely voters. All three waves used that sample size; reported credibility intervals were ±3 points in August and September and ±3.1 points in October.
For the 2-point August-to-October increase, illustrative independent-wave calculations give:
- Binomial 95% interval: −2.37 to +6.37 percentage points
- Published-width normal approximation: −2.31 to +6.31 points
Both include zero, but neither is an Emerson posterior or design-adjusted interval. October added Spanish-language interviewing and landline interactive voice response and listed different weighting variables. Exact ballot wording and likely-voter-screen comparability remain unverified.
A comparable-questionnaire and turnout-screen record, operational Bayesian formula and priors, design-adjusted variances or effective sample sizes, and cross-wave covariance assumptions are needed for a definitive change test. KXAN reports that August did not ask undecided voters’ leanings; the comparison above consistently uses initial ballots.
5. The poll director predicted Paxton would benefit if Brown’s support fell, while Talarico would benefit if it held
Verified.
Emerson’s release explicitly attributes this conditional assessment to polling director Spencer Kimball. It reports Brown at 3% including leaners and says his supporters are primarily independents or Republicans.
This verifies what Kimball said, not the predicted transfers. The published ballot changes—Talarico 48% to 49%, Paxton 46% to 48%, and Brown **1% to 3%**—allocate initially undecided voters; they do not measure future Brown defections.
Arithmetic illustrates why the destination matters:
- Moving all Brown support to Paxton would produce 51% Paxton versus 49% Talarico.
- Moving all Brown support to Talarico would produce 52% Talarico versus 48% Paxton.
These are hypothetical endpoints, not forecasts. The AOL-republished report gives Republicans as 44% and independents as 23%, totaling 67% of all respondents, not Brown supporters. Those figures do not establish Brown voters’ party composition or second choices.
Explanation tested
Open — The predicted movement toward Paxton is unsupported by Brown supporters’ reported candidate preferences.
The accessible release bases the forecast on party identification rather than direct second-choice preferences. That does not establish where Brown supporters would go, but missing preference evidence also does not demonstrate that Paxton lacks an advantage among them.
The unavailable full-results workbook was needed for Brown supporters’ party identification, second choices, candidate favorability, any ballot excluding Brown, unweighted subgroup base, and subgroup uncertainty. The poll’s overall ±3.1-point interval cannot quantify uncertainty for this subgroup. A direct second-choice or Brown-excluded ballot showing a clear Paxton advantage would rule out the suspected weakness; no such result was available.
About the text as a whole
Likely-voter screening
Open — The likely-voter results include registered voters who failed a turnout-likelihood screen.
Emerson’s October methodology labels the sample 1,000 Texas likely voters but describes recruitment from registered voters without specifying a turnout screen or voter-history eligibility rule. Emerson’s general methodology describes registration, demographic, and data-quality checks, not this poll’s turnout routing.
Registered-voter recruitment does not prove that ineligible respondents entered the reported sample. The workbook’s exact screening questions, routing, and response bases were unavailable, so neither the inclusion nor exclusion of screen failures—and no count or share of them—could be established.
Weighting and the credibility interval
Open — Weighting reduced the effective sample size below 1,000, causing the reported ±3.1-point interval to understate uncertainty.
The release discloses weighting by gender, education, and region but gives no effective sample size, design effect, weight-efficiency statistic, or reproducible interval calculation. Emerson’s methodology describes Bayesian, non-probability analysis without a usable formula.
A simple-random-sample benchmark at 50% with 1,000 respondents and 95% coverage yields ±3.098975 points, rounding to ±3.1. That resemblance does not prove that Emerson omitted a weighting adjustment.
A documented design effect above 1 that was excluded from the calculation would confirm the weakness. A calculation incorporating weighting and still rounding to ±3.1, or documented negligible weight variation, would rule it out. Those diagnostics were unavailable.
Sponsorship and commissioning
Open — The poll identifies Nexstar Media as sponsor but does not disclose whether it also commissioned the work.
The October release states, “The survey was sponsored by Nexstar Media.” It does not identify a commissioner.
That establishes the disclosed sponsor, not who commissioned the survey or a separate payment arrangement. The full-results workbook’s acknowledgments and credits were unavailable, so a commissioning disclosure there could not be ruled out. The author credit to Camille Mumford does not identify a commissioner.
Limits of this check
- The October full-results workbook could not be obtained through its linked spreadsheet URL, direct page, download link, or Excel export, leaving unrounded ballots, leaner allocation, screening, subgroup preferences, uncertainty diagnostics, and commissioning credits unchecked.
- The September full-results workbook was unavailable, preventing verification of exact issue wording, response options, and inputs for a method-consistent September-to-October change interval.
- The August full-results workbook was unavailable, preventing verification of ballot and turnout-screen comparability and the inputs for an official August-to-October trend interval.