Marist Michigan midterm poll
Marist's survey is rated 'Reliable' despite significant methodological gaps, as its core numerical claims align with published data.
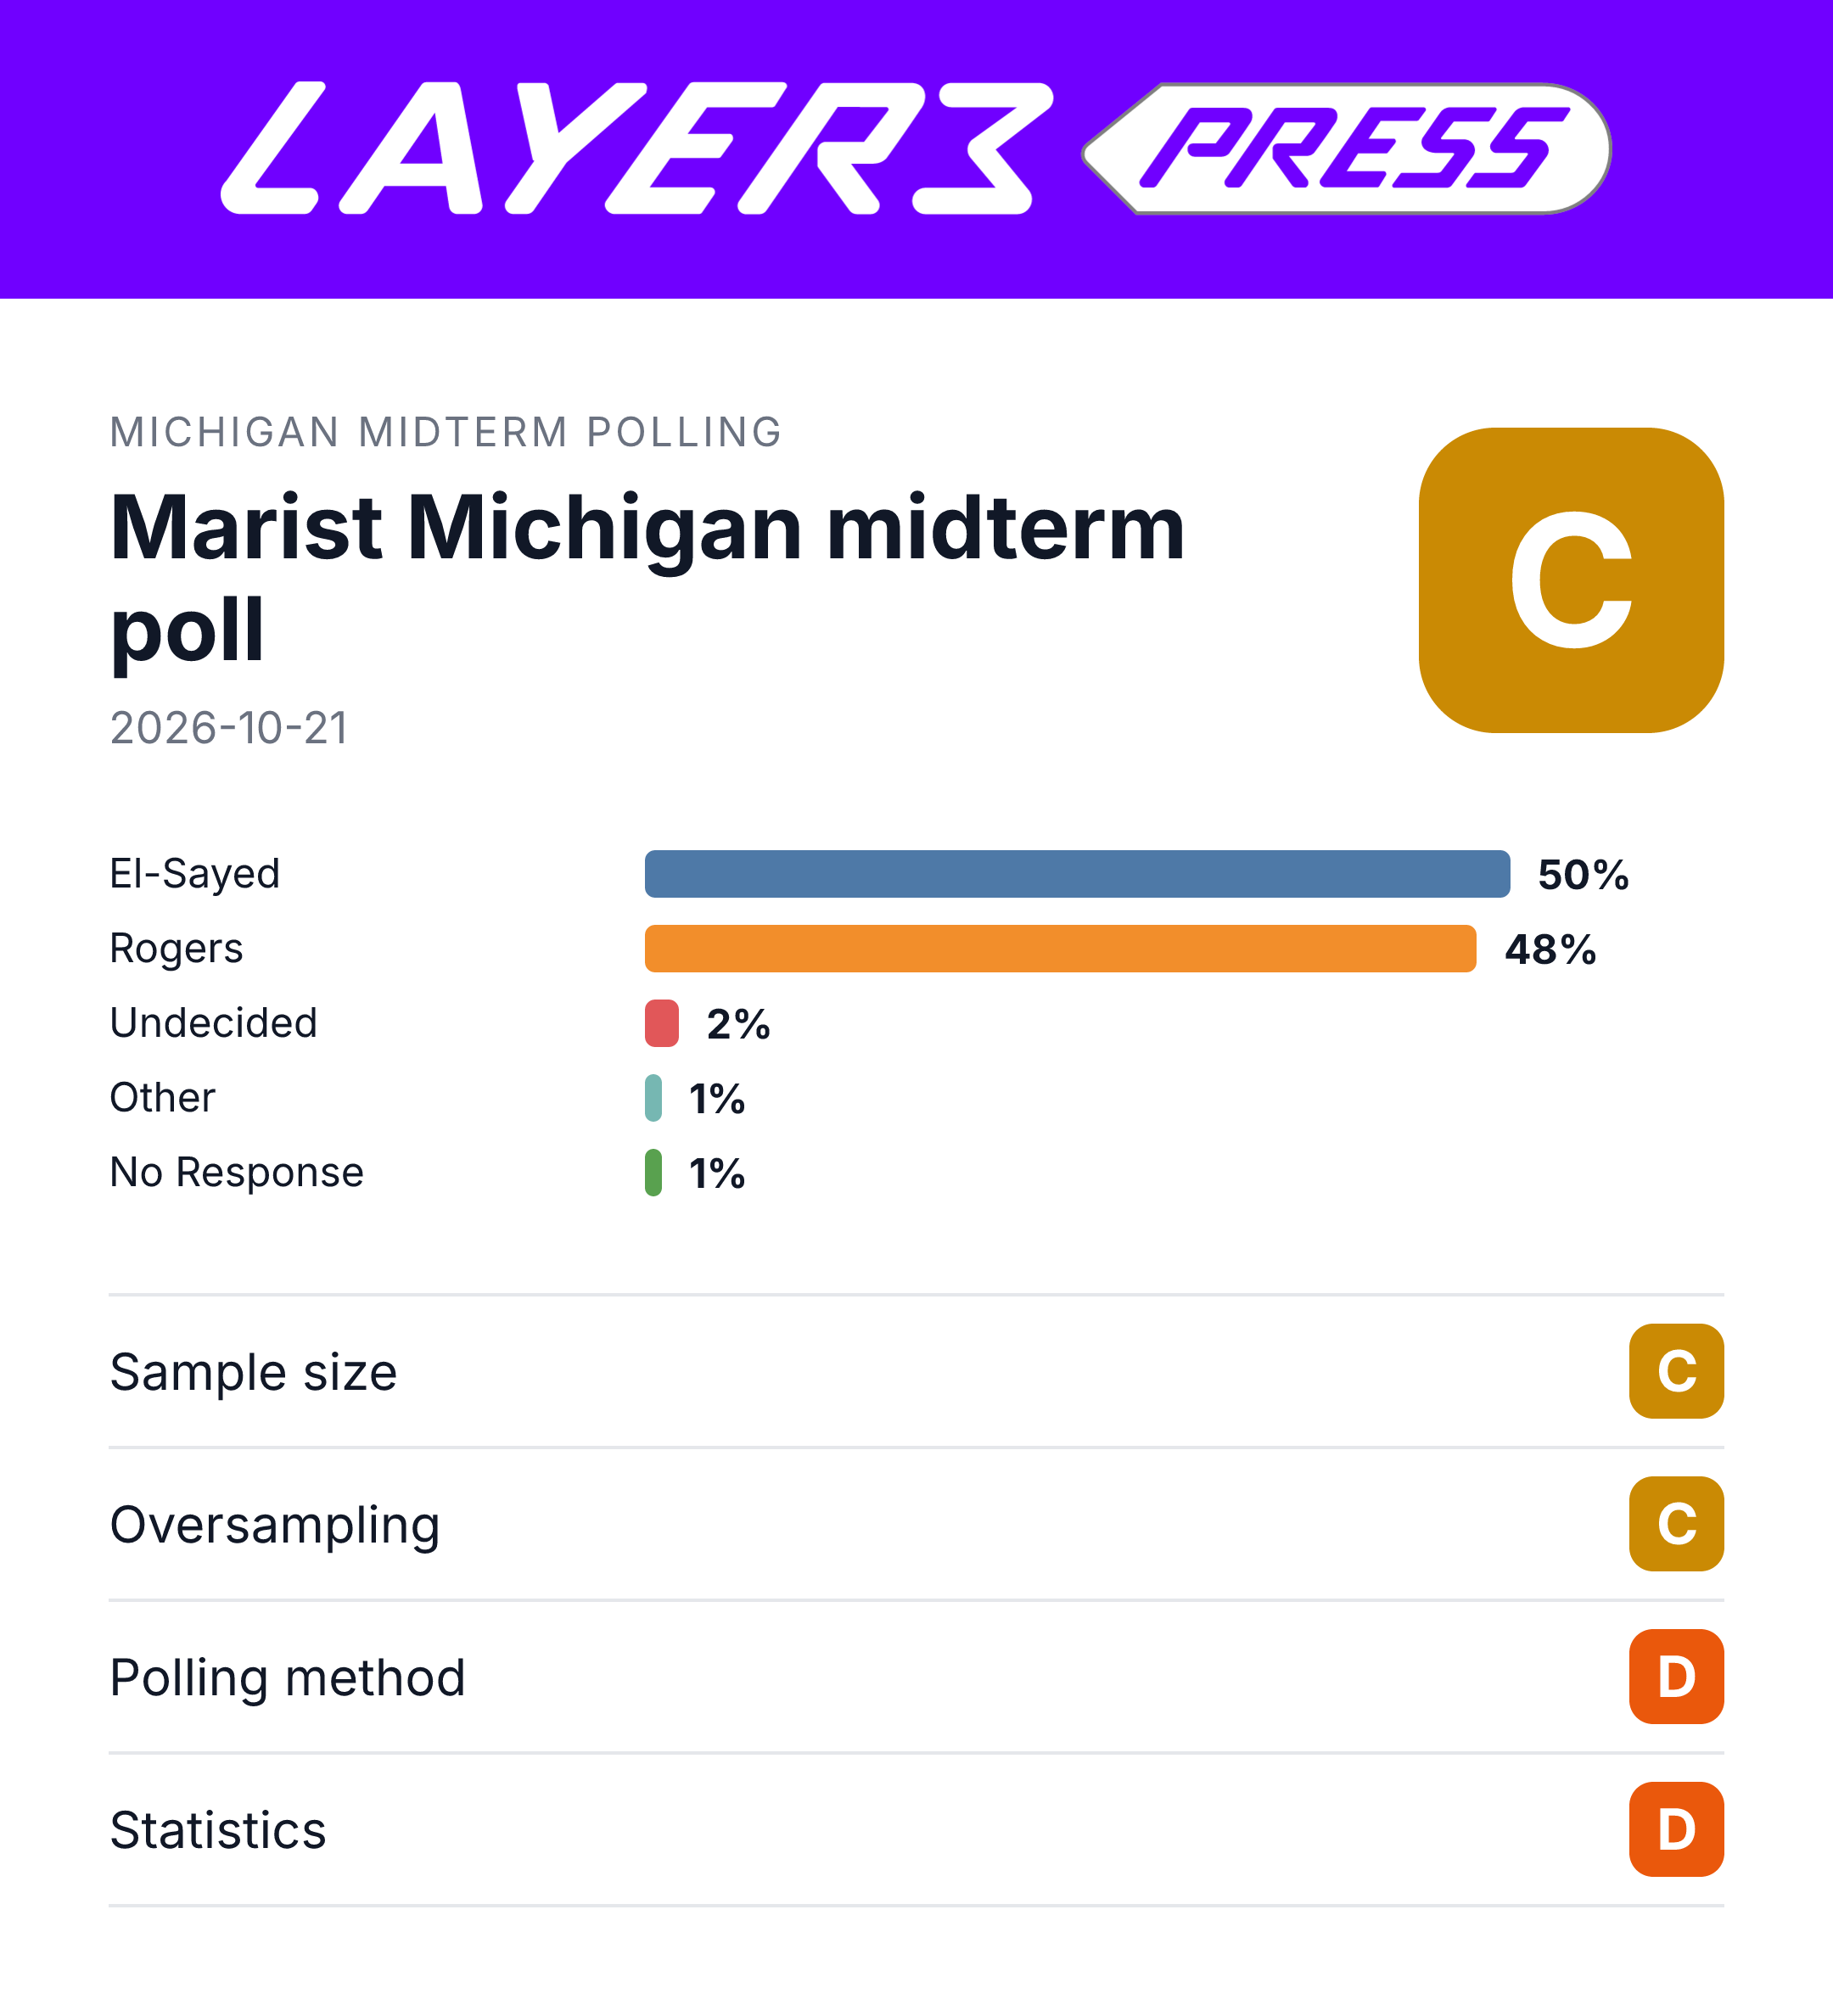
Overall grade: C
All five checked numerical claims match the published tables, including the 50%–48% Senate result and both six-point leads. However, missing panel-recruitment and text-selection details, the absent likely-voter count and an unresolved uncertainty framework limit confidence in the estimates’ precision; approximate intervals for both six-point leads include a tie. Oversampling could not be assessed, and release-specific commissioning and payment were not disclosed.
Confidence: High. All five checked findings were resolved with no failed checks, analyses or source retrievals, although oversampling and several disclosure details were not assessed.
Graded assessments
- Polling method — D: Marist identifies live phone, text and online interviewing and random selection of telephone records from L2’s voter database. Initial online-panel recruitment and Michigan’s text-selection protocol remain undisclosed, preventing verification of probability-based recruitment across the combined sample.
- Statistics — D: The 1,185-person registered-voter sample, ±4.0/±4.3-point margins and 1.94 design effect are disclosed, but the unweighted likely-voter base and a justified uncertainty framework across recruitment modes are missing, as are an explicit confidence level and direct tests of the reported leads. Approximate intervals for both six-point leads include zero; nonresponse handling, missing-data procedures and multiple-comparison adjustments were not assessed.
- Sample size — C: The full sample is clearly reported as 1,185 registered voters, but the unweighted likely-voter count underlying the headline results is not stated. The approximate effective size of 519.4 inferred from the ±4.3-point margin is assumption-dependent and does not replace that missing count.
- Oversampling — C: The evidence does not establish whether demographic or geographic groups were deliberately oversampled or how any such oversampling was corrected. The disclosed counts—277 phone, 698 text and 210 online respondents—describe interview modes, not demographic sampling allocations.
- Methods — D: The population, voter-database frame, October 15–18 fieldwork and mixed interview modes are identified, but initial online-panel recruitment and the text-invitation selection protocol are not disclosed; likely-voter weighting is described only as estimated voting probability. Exact question wording and order, weighting variables and targets, eligibility-model details and any preregistration deviations were not assessed in the supplied check.
- Findings — B: All five checked claims match the published tables, including El-Sayed’s 50%–48%, Benson’s 51%–45% and Democrats’ 52%–46%. These are checks of rounded published estimates, not respondent-level recalculations; the release’s other findings were not separately verified.
- Conclusions — B: The reported leads accurately describe numerical differences, but statistical significance is not established: approximate 95% intervals are −2.41 to +14.41 points for the governor race and −2.50 to +14.50 for the generic ballot. This limits the strength of the advantage language without making the published percentages misleading.
- Data — B: Published result tables support all five checked claims, and their rounding caveats account for totals such as the Senate chart’s 102%. Respondent-level data, respondent weights and unrounded weighted counts are unavailable, and analysis-code availability was not established.
- Replication — B: The published tables reproduce the reported shares and arithmetic leads, but missing respondent-level data, weights and design-specific variance information prevent independent regeneration of estimates and exact lead intervals. The two PDF versions are duplicates, and no independent replication was supplied.
- Funding — C: Marist University is explicitly identified as the institutional funder, but the documents do not identify this release’s commissioner or payment arrangement. Author and sponsor conflict-of-interest disclosures were not assessed, and the evidence does not establish sponsor influence.
Fact-check report
- Rating: Reliable
- Date checked: October 26, 2026
- Text published: October 21, 2026
- Claims checked: 5 — 5 verified, 0 wrong or misleading, 0 unverifiable
- Sources: 3 linked; 0 needed sources unavailable or only partly obtained
Overall assessment
Reliable. The five checked numerical claims match Marist’s published survey tables, and the reported leads reproduce from those tables. The six-point governor and congressional-ballot leads are numerical advantages, not statistically established leads: approximate 95% intervals include a tie. No newer comparable measurement was supplied that overturns these results.
Claims
1. El-Sayed leads Rogers 50% to 48%, with Other at 1%, Undecided at 2%, and No Response at 1%
Verified.
Recalculation from Marist’s Survey Data tables confirms every stated share among Michigan likely voters interviewed October 15–18, 2026. Subtracting 48% from 50% gives the reported two-percentage-point lead.
The five published shares total 102%, not 100%. Marist warns that totals may differ because of rounding. The arithmetic uses rounded published percentages; it does not independently reproduce estimates from individual responses.
The methodology applies to all five claims:
- The full sample was 1,185 Michigan registered voters aged 18 or older, not a separately reported likely-voter sample.
- Likely-voter estimates use weights reflecting estimated voting probability. A separate, unweighted likely-voter count is not stated.
- The reported margins are ±4.3 percentage points for likely voters and ±4.0 points for registered voters, incorporating a 1.94 design effect.
- Marist supplies no explicit confidence level for those margins, candidate-difference interval, or direct significance test. The two-point Senate gap therefore does not establish a statistically significant advantage.
- Respondent-level data and unrounded weighted totals are not supplied. Those data, together with weights and variance information, would be needed to regenerate the estimates and test the difference exactly.
The October 21 release agrees with the tables. The two retrieved PDF URL versions contain the same results and are not independent polls.
2. Benson has 51% support and a six-point lead over James
Verified.
Recalculation from Marist’s governor table confirms Benson 51%, James 45%, among Michigan likely voters interviewed October 15–18, 2026. The difference is 6 percentage points, as stated. All response categories total 100%.
These are rounded, weighted survey estimates. The published material does not establish that the lead is statistically significant.
Explanation tested: The six-point lead is not statistically distinguishable from a tie at 95% confidence
Weakness confirmed.
Under a common-design approximation, the 6-point lead has an approximate 95% confidence interval of −2.41 to +14.41 percentage points, including zero.
The calculation assumes that the published ±4.3-point margin is a maximum-proportion margin at 95% confidence:
- Implied effective sample size: 519.4
- Approximate margin for the candidate difference: ±8.41 points, not ±4.3 points
- Approximate two-sided p-value: 0.162
This limits what “six-point advantage” establishes; it does not contradict the reported sample percentages. The interval is recomputed from Marist’s published figures, not a significance test published by Marist. A design-specific variance estimate or direct test, including the weighted covariance, would settle the exact uncertainty.
3. Democrats lead Republicans 52% to 46% on the generic congressional ballot
Verified.
Recalculation from Marist’s congressional-ballot table confirms 52% Democratic support and 46% Republican support among Michigan likely voters interviewed October 15–18, 2026. Subtraction gives the stated 6-point lead.
All published response categories total 101%, consistent with the table’s rounding warning. The lead can be reproduced from rounded shares, but not independently regenerated without respondent-level data.
Explanation tested: The six-point Democratic lead is not statistically distinguishable from a tie at 95% confidence
Weakness confirmed.
The approximate 95% confidence interval is −2.50 to +14.50 percentage points, including zero.
Using the same maximum-proportion, 95% assumption described above:
- Implied effective sample size: 519.4
- Approximate margin for the Democratic–Republican difference: ±8.50 points
- The published 1.94 design effect is already incorporated in the reported margin and is not added again.
These results are recomputed from Marist’s published shares and margin. They confirm a numerical lead but not a statistically established advantage. Marist supplies no direct difference test, explicit confidence level, likely-voter count, or exact weighted covariance; a design-specific interval would settle the exact uncertainty.
4. Trump’s job approval is 42%, with 57% disapproving
Verified.
Marist’s survey table confirms 42% approve and 57% disapprove among Michigan likely voters interviewed October 15–18, 2026.
Adding the published approval-intensity components gives 27% + 16% = 43%, compared with the published net approval of 42%. The disapproval components total 57%, matching the net. These differences are compatible with whole-percentage rounding and do not contradict the published net figures.
This finding rests on the source’s table and arithmetic checks, not a re-estimate from microdata. Marist’s ±4.3-point likely-voter margin is the available uncertainty measure; outcome-specific confidence intervals and p-values are not reported. Unrounded percentages or weighted respondent data would settle the exact component totals.
5. Family finances worsened for 43%, stayed the same for 40%, and improved for 16%
Verified.
Marist’s family-finances table confirms all three figures among Michigan likely voters interviewed October 15–18, 2026, describing their finances over the preceding year:
- 43%: gotten worse
- 40%: stayed about the same
- 16%: gotten better
The three main responses total 99%. The table also reports 2% no response and <1% unsure; numeric cells total 101% before “unsure”. Marist’s rounding caveat applies.
These are published weighted estimates, checked against the source table. Respondent-level data, weights, and exact category counts are not supplied for independent regeneration. Category-specific intervals and p-values are also absent; the reported overall likely-voter margin is ±4.3 percentage points.
About the text as a whole
The ±4.3-point margin may treat nonprobability recruitment as conventional sampling error
Open.
The survey PDF reports 277 phone, 698 text, and 210 online respondents, totaling 1,185 registered voters. The online share is 17.72%; these are not likely-voter mode shares.
Marist says telephone records were randomly selected from L2’s Michigan voter database. Online respondents were randomly selected within aggregated panels whose members Cint had matched to that database. Random selection within panels does not establish how people were initially recruited into those panels, and the Michigan text-invitation selection protocol is not specified.
The reported 1.94 design effect, applied to 1,185 respondents under a 95% normal approximation at 50%, yields a registered-voter margin of 3.965 points, matching the published ±4.0 points after rounding. That numerical agreement does not establish probability-based recruitment.
Neither the PDF nor Marist’s official methodology page establishes Michigan-specific nonprobability recruitment or probability recruitment across every mode. Neither identifies and justifies a model-based uncertainty interval; the likely-voter turnout model is not such an interval.
A poll-specific technical disclosure would settle this question by providing the panel suppliers and initial recruitment, text sampling and invitation protocol, unweighted likely-voter base, exact margin formula and confidence level, and any model-based uncertainty justification.
The poll’s commissioner and funder are not disclosed
Weakness ruled out.
The official survey PDF states: “The Marist Poll is an educational program in public opinion research and funded by Marist University.” That contradicts the blanket assertion that no funding source is disclosed.
The disclosure identifies an institutional funder, not necessarily the commissioner or payer for this particular release. The supplied official documents do not identify a release-specific commissioner or payment arrangement, or explicitly say Marist commissioned and funded this poll itself. A release-specific commissioning or payment statement would resolve that narrower question; the available evidence does not establish sponsor influence.