Times/Siena seven-state Senate polls
Mostly reliable poll findings that largely reproduce aggregate data, but with key methodological details and specific claims unverified.
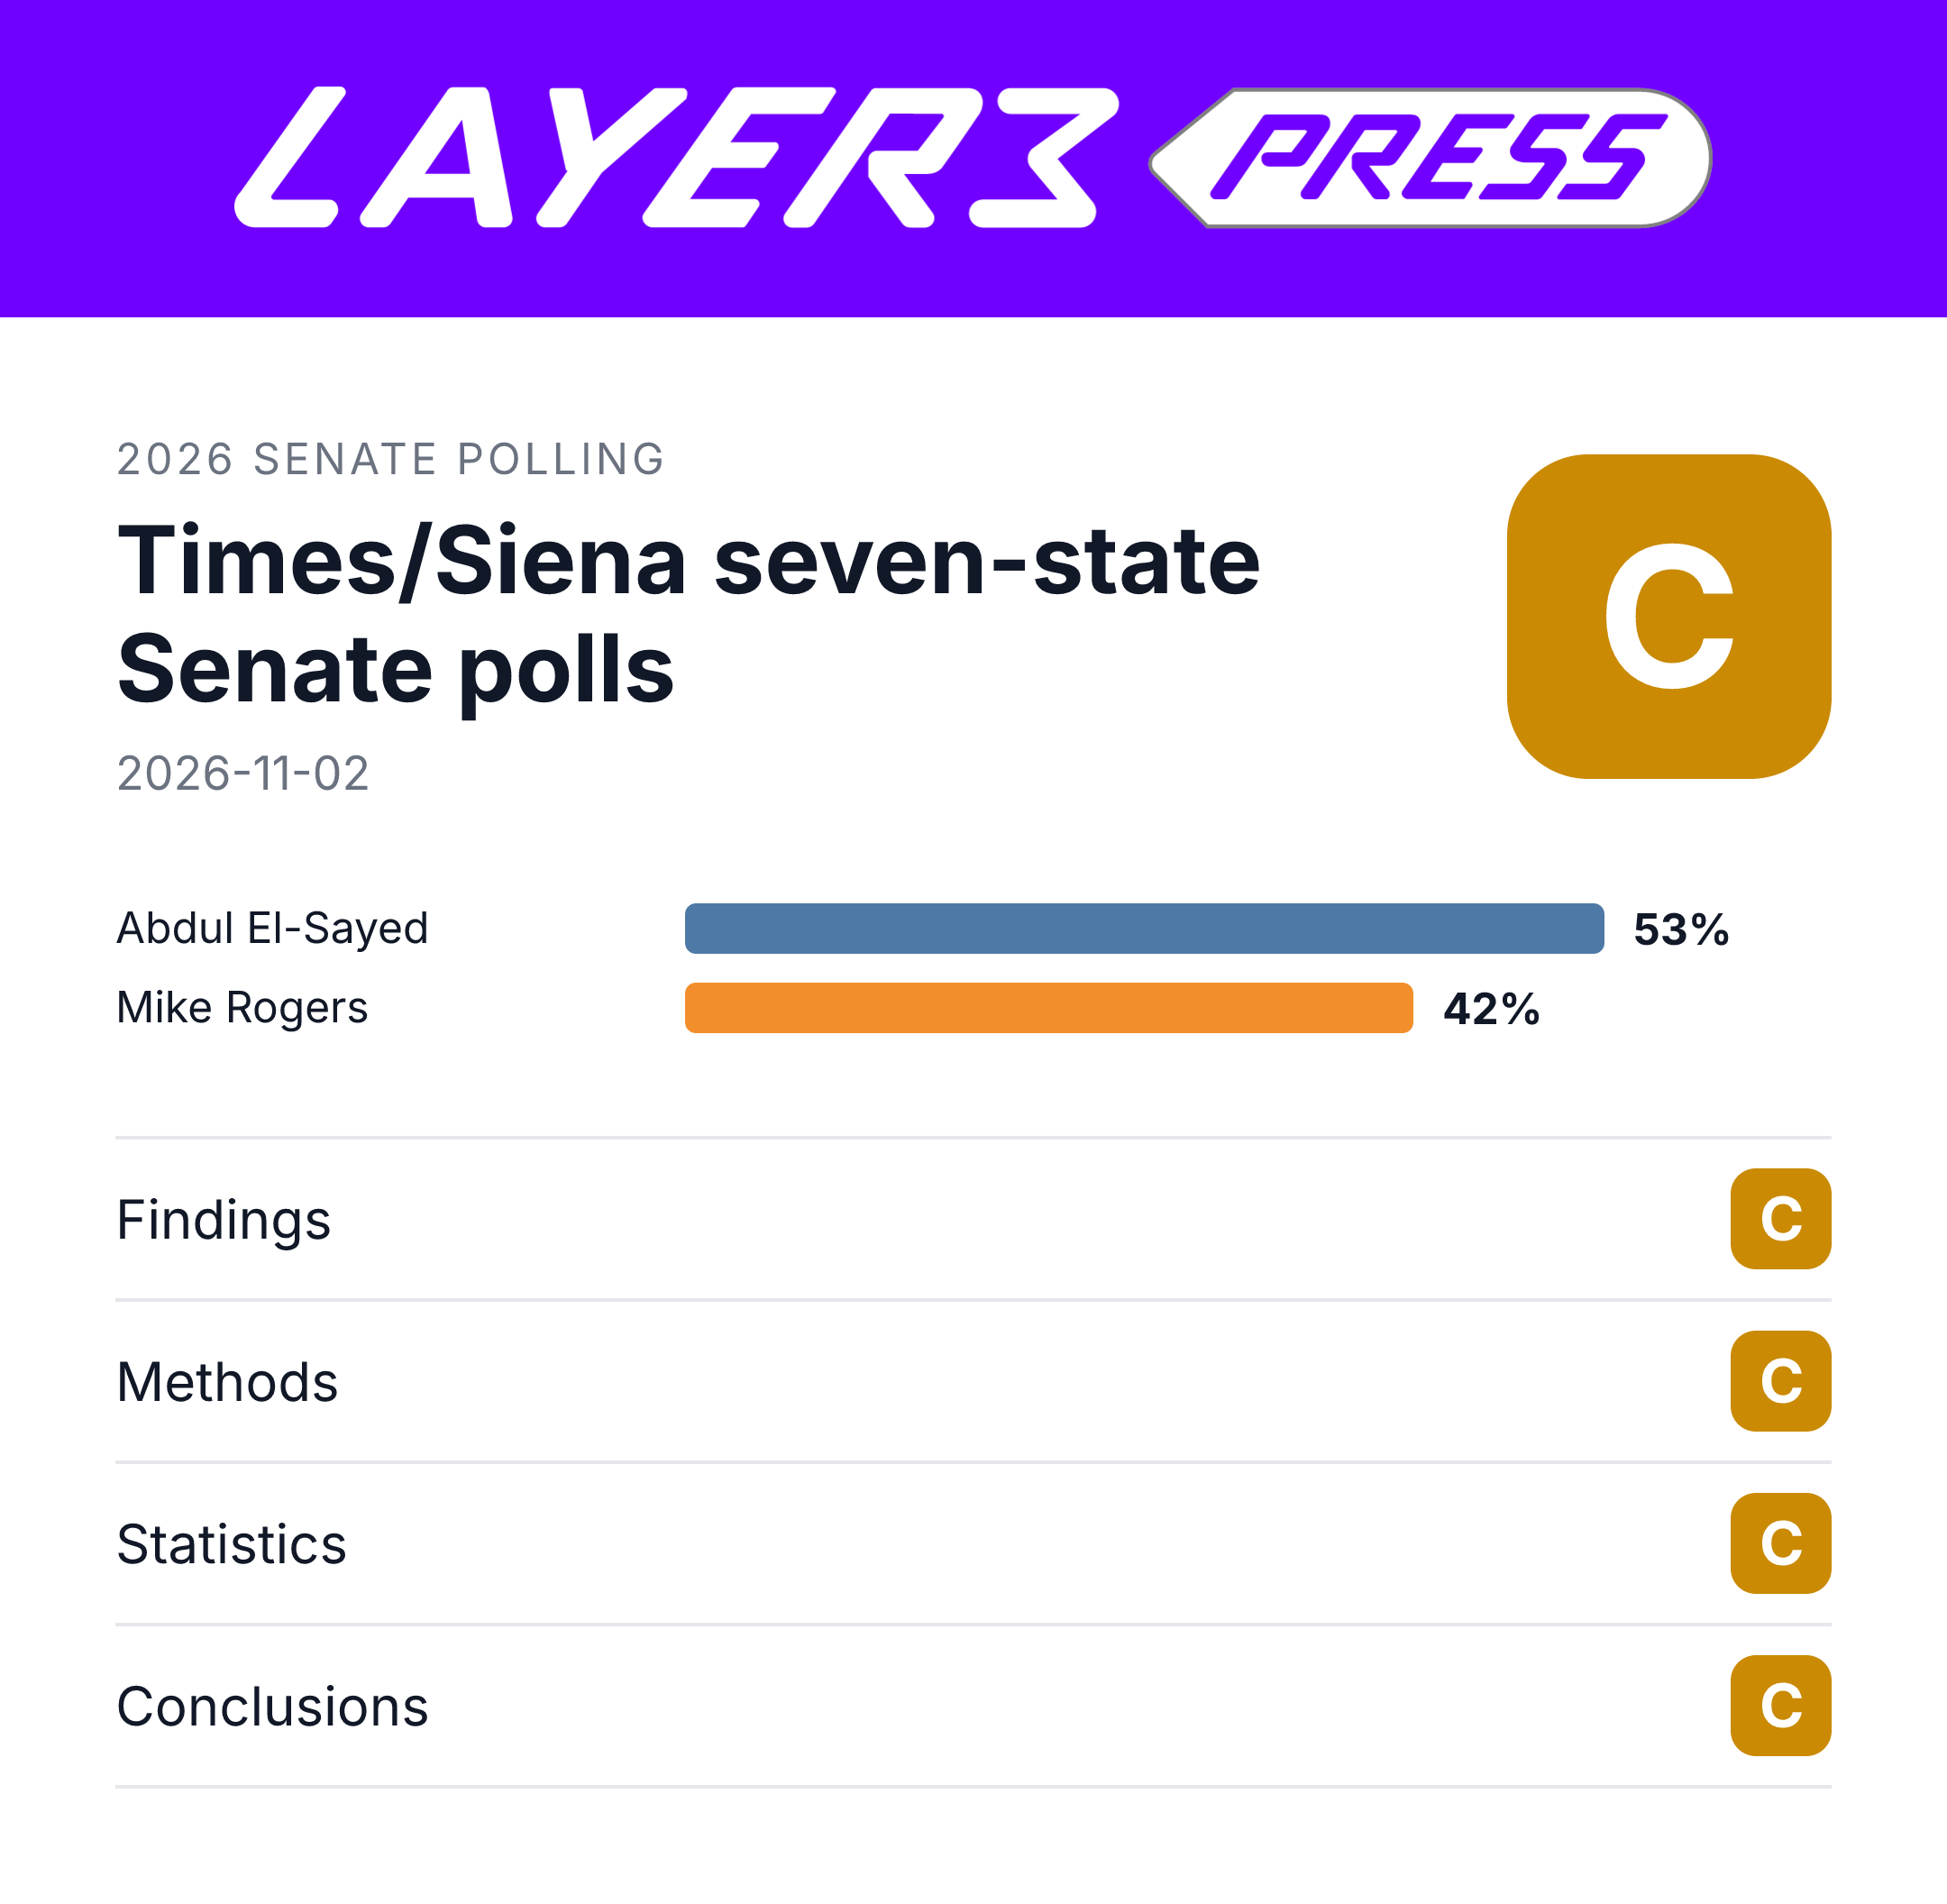
Overall grade: C
The seven Senate results and cost-of-living margins reproduce from the published aggregate data, but the reported 38% Trump approval does not have supporting tables in the supplied materials. Unassessed questionnaires, weighting and eligibility details, unexplained uncertainty differences, and an unsupported causal interpretation limit the assessment.
Confidence: Medium. All 18 checks and 18 analyses completed without errors and eight of nine claims were verified, but three linked methodological documents were not supplied, leaving approval, detailed methods and funding partly unassessed.
Assessment
- Replication — B: The published aggregate data reproduce the Senate shares and trust margins, including Ohio’s 5.62-point and Alaska’s 1.39-point leads. Respondent-level responses, code and weights were not supplied for full regeneration, and Siena’s release and the Alaska archive repeat the same polls rather than independently replicate them.
- Findings — C: All seven Senate results and the cost-of-living trust margins reproduce from the published aggregate data. The reported 38% Trump approval cannot be verified against supporting approval tables.
- Methods — C: The supplied texts identify likely voters, voter-list sampling, live telephone interviews and the October 23–November 1 polling window, but describe weighting only generally. Exact question wording and order, selection procedures, weighting variables and targets, the likely-voter screen, state-specific dates and any oversampling remain unassessed because the linked questionnaires and detailed methodology were not supplied.
- Statistics — C: State sample sizes of 610–1,215, sampling margins and design effects support approximate uncertainty calculations, but the article and Siena report unexplained differences in their error margins. Approval and issue-specific denominators, confidence-level definitions, candidate-difference covariance or official tests, nonresponse and missing-data handling, and multiple-comparison procedures were not established by the supplied evidence.
- Data — C: Unrounded Senate and issue tables support the checked results, including all seven cost-of-living margins. Approval toplines, state approval results and pooling weights were not supplied, nor were respondent-level responses, analysis code or individual weights; the contents of the linked full crosstabs remain unassessed.
- Funding — C: The Maine Trust for Local News is named as a partial sponsor for one of seven polls, but the supplied texts do not establish complete commissioning, payment or author-and-sponsor conflict disclosures. Funding statements in the linked methodology and FAQ were not assessed, so a public-disclosure failure is not established.
- Conclusions — C: The Senate point estimates support the broad account of Democratic strength, without establishing every apparent lead as statistically secure. The claim that dissatisfaction with Trump is dragging down Republicans lacks a demonstrated causal effect and does not exclude shared partisan or candidate preferences.
Fact-check report
- Rating: Mostly reliable
- Date checked: November 2, 2026
- Text published: November 2, 2026, at 00:53:08 UTC
- Claims checked: 9 — 8 verified, 0 wrong or misleading, 1 unverifiable
- Sources linked: 7, including three methodology documents not supplied for this assessment. No source was reported as unavailable or partially fetched.
Overall assessment
Mostly reliable. The Senate vote shares and cost-of-living trust margins reproduce the article’s figures after rounding. Several leads remain compatible with a tie under approximate uncertainty calculations, but that does not contradict their description as polling point estimates. The reported 38% Trump approval and the claim that dissatisfaction with him is causing Republican weakness remain unverified.
Claims
All results below concern likely voters in the seven surveyed states during the overall polling window of October 23–November 1, 2026. That window does not establish each state’s separate interview dates.
The numerical findings rest on arithmetic recomputed from the New York Times article’s published data, not a reconstruction from individual responses. The Siena Research Institute release corroborates the rounded Senate shares; it reports the same polls, not independent measurements.
The approximate 95% intervals below assume mutually exclusive responses, the full state samples, a normal approximation, and Siena’s state design effects applied to the variance and covariance of the candidate-share difference. They are not publisher-issued intervals and exclude nonsampling error. Respondent-level responses and weights, weighted candidate counts, the full questionnaire and likely-voter screen, detailed sample composition and weighting, official difference intervals or p-values, and definitions of the uncertainty fields were not supplied.
1. Michigan: Abdul El-Sayed led Mike Rogers, 53% to 42%, an 11-point margin
Verified.
Among 1,011 Michigan likely voters, the published unrounded shares were:
- El-Sayed: 52.57575541%, rounding to 53%.
- Rogers: 41.63425075%, rounding to 42%.
- Recomputed difference: 10.94150466 percentage points, rounding to 11.
The approximate 95% interval for the lead is 4.09 to 17.80 points, with standard error 3.50 points, using Siena’s design effect of 1.33. It excludes a tie under those assumptions.
The article’s embedded sampling-error value is ±3.60145812 points; Siena reports ±3.8 points. Their definitions do not establish why they differ or whether they measure precisely the same uncertainty. Neither is an error margin for the candidate difference.
Sources: New York Times; Siena Research Institute.
2. Texas: James Talarico led Ken Paxton, 50% to 43%, a 7-point margin
Verified.
Among 1,215 Texas likely voters, Talarico’s 50.21505700% and Paxton’s 43.09747846% produce a 7.11757854-point lead. All three figures round to those stated.
Using Siena’s design effect of 1.29, the approximate 95% interval for the lead is 0.97 to 13.27 points. It excludes a tie under the stated assumptions.
The article reports ±3.3 points sampling error, consistent with its embedded ±3.255058522. Siena reports ±3.4 points. The difference is unexplained; neither value is a lead-specific error margin.
Sources: New York Times; Siena Research Institute.
3. Maine: Troy Jackson led Susan Collins, 51% to 45%, a 6-point margin
Verified.
Among 714 Maine likely voters, Jackson’s 50.91815184% and Collins’s 45.03969601% produce a 5.87845583-point lead. These round to 51%, 45%, and 6 points.
This verifies a poll estimate, not a statistically established population lead.
Explanation tested
Open — Jackson’s approximately six-point lead is not statistically distinguishable from a tie at the 95% level.
Using Siena’s design effect of 1.47, the approximate interval is −2.82 to 14.57 points, with standard error 4.4368 points and two-sided p=0.185. It includes zero.
The official conclusion remains unresolved because the actual weighted covariance or an official Jackson-minus-Collins interval was not supplied. The uncertainty figures also differ:
- Article’s embedded margin: ±4.349260899 points.
- Siena’s published margin: ±4.7 points.
- Maximum single-share margin under the simple sample-size/design-effect model: ±4.446596 points.
Those differing bases cannot be reconciled from the supplied definitions.
Sources: New York Times; Siena Research Institute.
4. Ohio: Sherrod Brown led Jon Husted, 49% to 44%, with a 6-point margin calculated from unrounded shares
Verified.
Among 717 Ohio likely voters, Brown’s 49.30536674% and Husted’s 43.68360131% produce a 5.62176543-point lead, rounding to 6.
Siena’s prose instead gives 5 points, matching subtraction of the displayed 49% and 44%. The article’s underlying shares are primary for reproducing its stated unrounded-margin convention; the two presentations do not show different poll results.
Explanation tested
Open — Brown’s reported six-point lead is not statistically distinguishable from a tie at the 95% level.
With Siena’s design effect of 1.33, the approximate interval is −2.50 to 13.75 points, with standard error 4.1461 points and two-sided p=0.175. It includes zero.
That conclusion is conditional on modeled covariance, not the poll’s actual weighted covariance. An official difference interval, variance definitions, or replicate weights would settle it.
The article’s embedded single-share margin is ±4.248382331 points, compared with Siena’s ±4.4 points. The supplied definitions do not explain the difference.
Sources: New York Times; Siena Research Institute.
5. Kansas: Adam Hamilton led Roger Marshall, 49% to 44%, a 5-point margin
Verified.
Among 736 Kansas likely voters, Hamilton’s 49.00635275% and Marshall’s 43.94693596% produce a 5.05941679-point lead. The stated shares and margin are correct after rounding.
Explanation tested
Open — Hamilton’s five-point lead is not statistically distinguishable from a tie at the 95% level.
Using Siena’s design effect of 1.30, the approximate interval is −2.87 to 12.99 points, with standard error 4.046 points and two-sided p≈0.211. It includes zero.
The article’s embedded sampling margin is ±4.129074877 points, compared with Siena’s ±4.4 points. A maximum single-share calculation from the sample size and design effect gives approximately ±4.119 points. Calibrating the difference calculation to Siena’s published margin instead gives −3.41 to 13.53 points, also including zero.
Both approximations are consistent with a tie, but neither establishes the official survey-design interval. That requires the actual candidate-share covariance or a publisher-issued interval.
Sources: New York Times; Siena Research Institute.
6. Alaska: Mary Peltola narrowly led Dan Sullivan, 48% to 46%, with a 1-point margin calculated from unrounded shares
Verified.
Among 610 Alaska likely voters, Peltola’s 47.59993527% and Sullivan’s 46.21238682% produce a 1.38754845-point lead, rounding to 1.
Siena describes a 2-point lead, matching subtraction of the rounded 48% and 46%. The article’s underlying shares support its 1-point margin.
The approximate 95% interval is −7.93 to 10.71 points, using design effect 1.47; two-sided p=0.770. This is a narrow poll estimate, not an established population lead. The article reports ±4.8 points sampling error, consistent with embedded ±4.794973939, while Siena reports ±5.0 points.
Call the Map’s Alaska archive lists the same poll at 47.6% to 46.2%, a 1.4-point lead, with an October 30, 2026 label. This corroborates rounding but is neither a newer measurement nor evidence of the full interview window.
Explanation tested
Open — The result measures a prompted Peltola–Sullivan choice rather than first-choice preferences with every ballot-listed candidate named.
The article says, “Question wording has been condensed.” A two-candidate graphic does not establish which names interviewers read aloud.
The Alaska Division of Elections candidate list contains four ballot-listed non-write-in candidates: Gerald L. Heikes, Mary Peltola, Dan S. Sullivan, and Daniel J. Sullivan Jr., plus two certified write-ins. That makes the exact prompt consequential, but does not reveal it. The Alaska questionnaire, candidate-reading instructions, and rules for volunteered responses are needed to settle this explanation.
Sources: New York Times; Siena Research Institute; archive and official candidate list linked above.
7. Iowa: Josh Turek and Ashley Hinson were effectively tied, 48% to 47%, a 1-point Democratic margin
Verified.
Among 705 Iowa likely voters, Turek’s 47.56609685% and Hinson’s 46.86584616% produce a 0.70025069-point difference. The shares and margin round to those stated.
Using Siena’s design effect of 1.45, the approximate 95% interval is −7.94 to 9.34 points, a half-width of 8.64 points, with two-sided p=0.874. This supports “effectively tied,” not exact equality in the population.
The article’s embedded sampling margin is ±4.414125363 points, while Siena reports ±4.7 points. Their bases are not defined well enough to reconcile them.
Sources: New York Times; Siena Research Institute.
8. Trump’s 38% approval and dissatisfaction with his economic management are dragging down Republicans
Unverifiable. The approval figure lacks supporting approval tables, and the supplied evidence does not establish the asserted causal effect.
The article reports 38% approval among likely voters across the seven states. Its state sample counts sum to 5,708 interviews, but that is not a verified approval-question denominator or effective sample size.
The article reports an overall pooled sampling margin of ±1.5 points; Siena reports ±1.6 points, with pooled design effect 1.37. Applying those generic margins to 38% gives illustrative ranges of 36.5%–39.5% and 36.4%–39.6%, respectively. Neither is an established approval-specific interval.
Approval response counts, state approval percentages, the approval questionnaire, pooled toplines, and pooling weights were not supplied. The cost-of-living table measures trust in Senate candidates, not approval of Trump’s economic management.
Explanations tested
Open — The polls do not distinguish Trump dissatisfaction causing Republican weakness from party identification or candidate preferences causing both responses.
No causal effect estimate appears in the supplied article or release. The questionnaire and approval-by-Senate-vote crosstabs are missing, so the design’s ability to distinguish these explanations cannot be fully assessed. An association alone would not establish causal direction; the full design and any randomized or longitudinal analysis addressing common causes would settle the issue.
Open — The pooled 38% is weighted by interview allocation rather than the states’ likely-voter populations.
The article describes demographic reweighting but does not give relative state weights. Weighting solely by interview counts would allocate:
State | Hypothetical interview-count weight |
|---|---|
Alaska | 10.69% |
Iowa | 12.35% |
Kansas | 12.89% |
Maine | 12.51% |
Michigan | 17.71% |
Ohio | 12.56% |
Texas | 21.29% |
These are calculated possibilities, not published pooling weights. State approval toplines, likely-voter population totals, and the actual relative-state weighting rule are needed to reproduce and distinguish the alternatives. A rounded match under both methods would not settle which was used.
Sources: New York Times; Siena Research Institute.
9. Democrats led on cost-of-living trust by 16 points in Michigan, 10 in Ohio, 9 in Kansas and Texas, 7 in Maine, 4 in Iowa, and 2 in Alaska
Verified.
Recomputed differences from the article’s issue data reproduce every stated whole-point margin:
State | Likely-voter sample | Stated Democratic lead | Recomputed lead | Approximate 95% interval |
|---|---|---|---|---|
Michigan | 1,011 | 16 | 16.477 | 9.80 to 23.15 |
Ohio | 717 | 10 | 10.419 | 2.37 to 18.47 |
Kansas | 736 | 9 | 9.388 | 1.43 to 17.35 |
Texas | 1,215 | 9 | 8.779 | 2.62 to 14.93 |
Maine | 714 | 7 | 6.665 | −2.00 to 15.33 |
Iowa | 705 | 4 | 4.150 | −4.34 to 12.64 |
Alaska | 610 | 2 | 2.337 | −6.82 to 11.49 |
Margins and intervals are in percentage points. The intervals include a tie in Maine, Iowa, and Alaska under the stated assumptions. They additionally assume the full state samples and general survey design effects apply to this issue; issue-specific effective samples, intervals, and p-values were not supplied.
Siena does not independently publish these issue results in its release. The finding rests on the article’s own data, not repetition elsewhere.
Sources: New York Times; Siena Research Institute for design effects.
About the text as a whole
Other figures contradict the poll’s published tables
Open.
The article’s displayed and embedded results agree within rounding across 14 Senate-share values, 14 net-favorability values, 21 historical polling-display values, and 28 issue values. All 28 issue distributions, including “don’t know/refused,” sum to the full percentage base within numerical precision.
An apparent Maine immigration discrepancy is a label convention, not a demonstrated numerical error:
- One label shows +2 as a magnitude; the signed display shows −2.
- Democratic trust is 45.73565490%; Republican trust is 47.25223193%.
- The recomputed Democratic margin is −1.51657703 points, rounding to −2.
- “Don’t know/refused” is 7.012113167%.
The sampling-error differences documented under the claims remain unresolved. The matching results-and-methodology tables were not supplied, so those differences do not establish which source is wrong.
The following assertions remain unverified against matching primary comparison data:
- Texas last elected a Democratic senator in 1988, and Kansas in 1932.
- Democrats must defend their seats and flip at least four Republican seats.
- Trump won five surveyed states by double digits two years earlier.
- Nearly 98% of respondents were contacted on cellphones.
- Interviewers made more than 915,000 calls to more than 400,000 voters.
- Independent confirmation of field dates and sample composition.
The supplied article is an updated version, not a preserved snapshot of its original publication. No version-specific contradiction was established.
Sources: New York Times; Siena Research Institute.
The “99.7-moe” field is mislabeled as higher-confidence uncertainty
Open.
The numerical premise is confirmed: the embedded “99.7-moe” value is 33.993399% narrower than ordinary “moe” in every state.
State | Ordinary “moe” | “99.7-moe” |
|---|---|---|
Michigan | 3.601458 | 2.377200 |
Texas | 3.255059 | 2.148553 |
Maine | 4.349261 | 2.870799 |
Ohio | 4.248382 | 2.804213 |
Kansas | 4.129075 | 2.725462 |
Alaska | 4.794974 | 3.164999 |
Iowa | 4.414125 | 2.913614 |
If ordinary “moe” were a central 95% normal half-width for the same estimate, 99.7% coverage would require a multiplier of 1.514180. The observed multiplier, 0.660066007, would instead imply approximately 80.42% coverage.
That conditional calculation does not establish the fields’ publisher-defined meanings. Their confidence levels, target estimates, scales, and use in the displayed shading are not documented in the supplied evidence. The graphics’ rendering logic or actual band endpoints, together with field definitions, would settle whether there is a labeling error.
Source: New York Times.
Public documentation incompletely identifies commissioners and funders
Open.
The article names The Maine Trust for Local News as a partial sponsor of Maine polling and The Portland Press Herald as a collaborator. Collaboration alone is not evidence of funding.
Of the seven state polls, one has an explicitly named partial sponsor in the supplied article and release; six have no named sponsor there. None has a complete commissioning-and-financing account in those supplied texts.
This does not establish a gap across all public documentation. The full results-and-methodology page and methodology FAQ were not supplied, so their funding statements remain unassessed. Those documents’ accounts of commissioning and payment would settle the hypothesis.
Sources: New York Times; Siena Research Institute.
Limits of this check
- The November 1, 2026, seven-state results and methodology were not supplied, leaving approval toplines, pooling weights, detailed uncertainty, sample composition, causal-design information, and any funding statements unassessed.
- The Alaska questionnaire and crosstabs were not supplied, leaving the candidate names read aloud and volunteered-response rules unresolved.
- The Times/Siena methodology FAQ was not supplied, leaving any relevant uncertainty definitions and commissioning or funding disclosures there unassessed.